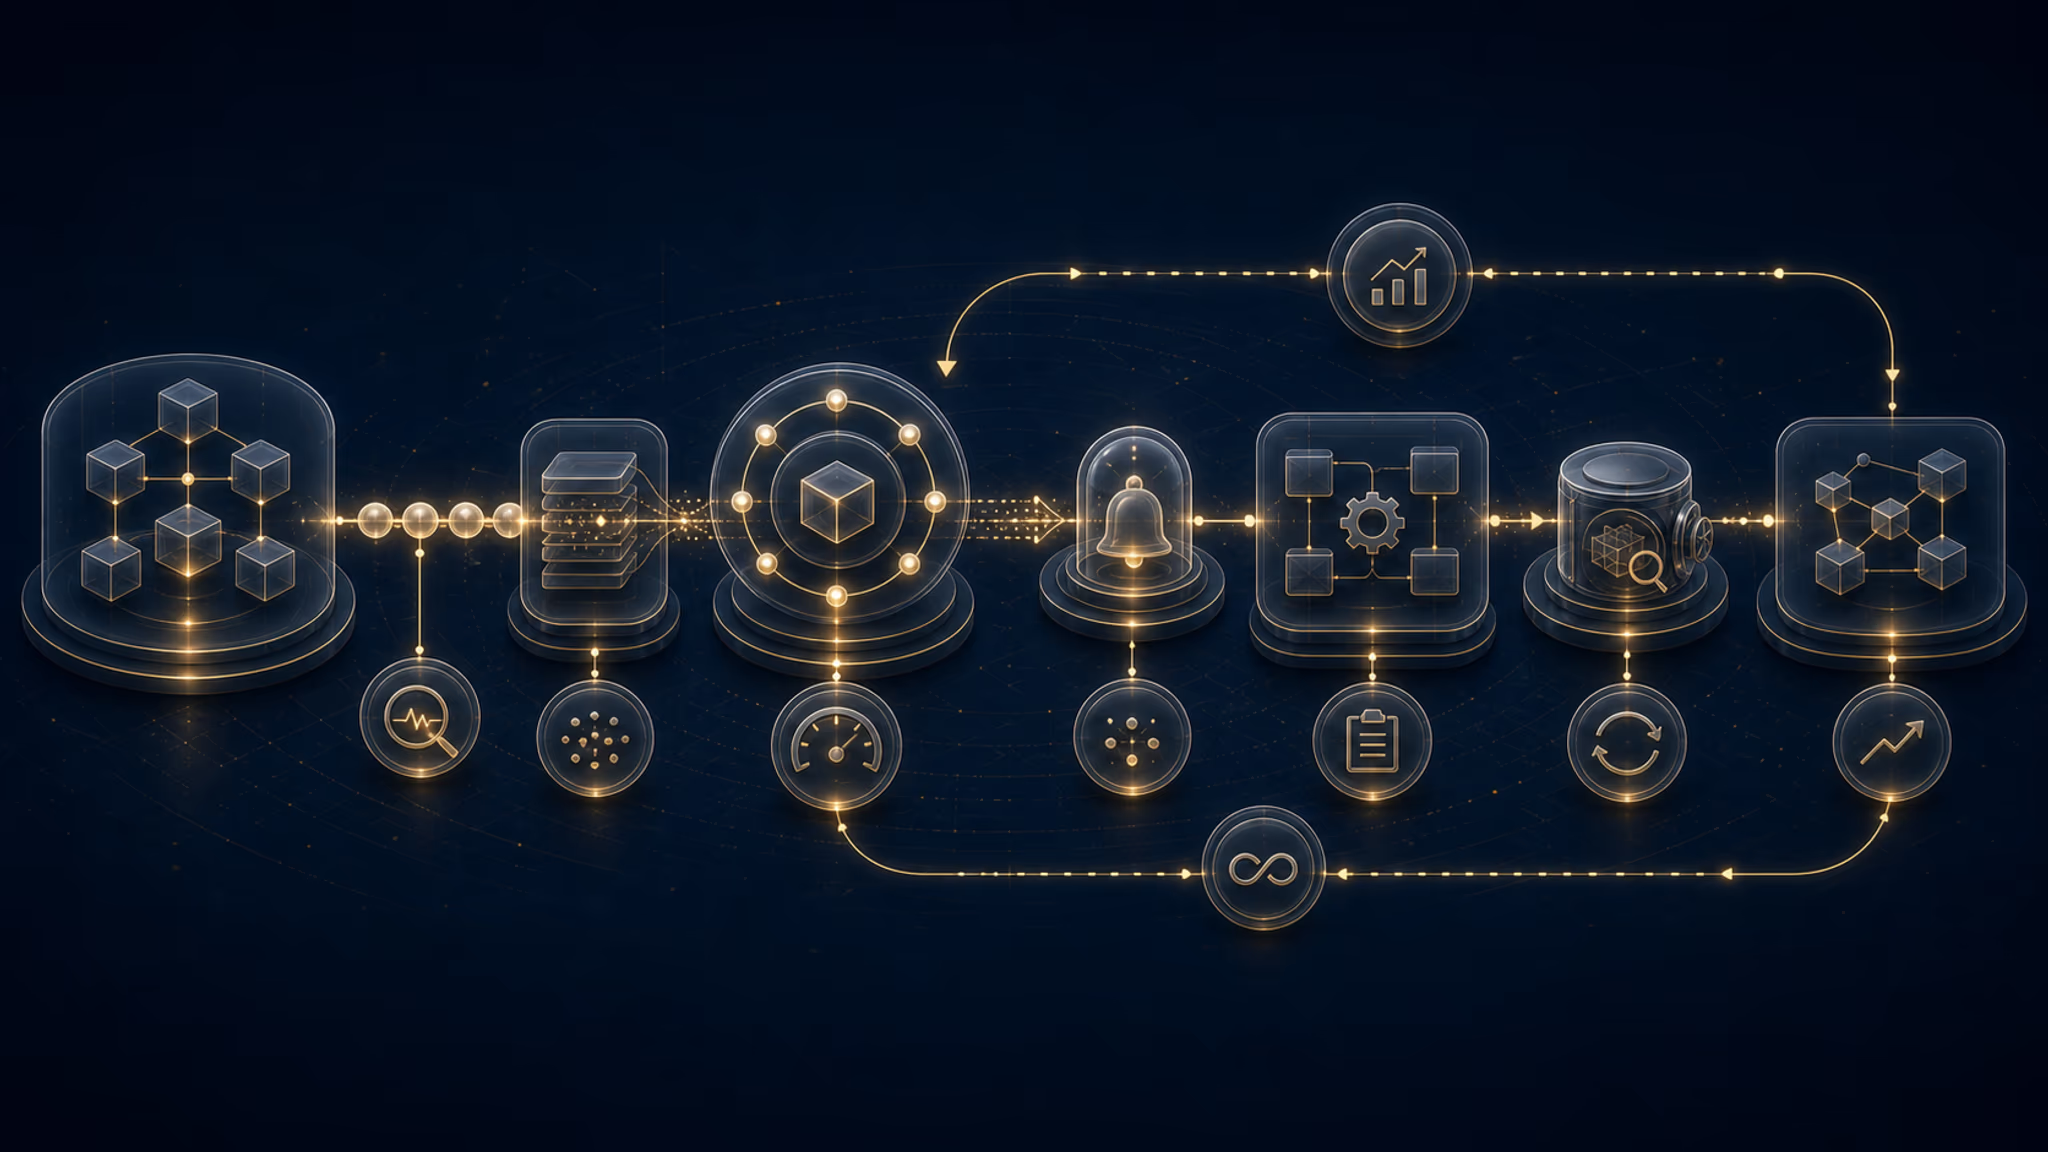
We set reliability targets with SLO/SLA/SLI definitions; observability infrastructure detects issues proactively and chaos engineering proves resilience.
EVIDENCEISO 27001DORAScope recordRisk note
01Current stateTopology, traffic, and dependency visibility.
02Target architectureSegmentation, capacity, and availability design.
03Controlled cutoverChange window, validation, and rollback plan.
04HypercareMonitoring, tuning, and operational handover.
POSITION
Where this service sits in the portfolio
SERVICE SCOPE
What this service addresses
The critical topics this service addresses and the outcome we deliver in each.
An SLO dashboard and observability are delivered
evidence readiness
We deliver the SLO dashboard, error budget tracker, an installed observability stack and incident runbooks; the output is evidenced in a structured monitoring stack.
On-call and exercises are defined by contract
contract-scoped
We design rotation-based on-call, escalation policies and chaos experiments; the exercise cadence and blast-radius limits are defined within contract scope.
Reliability is measured against targets
measured target
We set SLO targets for availability, latency and error rate; we measure operational time against targets with the error budget and dashboard, managing by measured values rather than promising them.
An independent reliability culture is gained
published after approval
With a blameless post-mortem template, toil automation and training we build your team's capacity to sustain SRE practices independently; the handover is validated on your side.
Delivery model
Delivery approach
How we phase the service across delivery, governance, and connected service pillars.
01
SLO design: we define SLO/SLI for availability, latency, throughput and error rate and balance speed against reliability with an error budget policy.
02
Observability: we build the metrics, logs and traces layer with Prometheus, Grafana and OpenTelemetry and find the source of issues quickly with distributed tracing.
03
Resilience: we design incident management and on-call processes, demonstrate resilience with controlled chaos-engineering experiments and reduce toil through automation.
Operating contexts
Example operating contexts
Illustrative surfaces where this service is commonly activated.
Unpredictable failures
Organisations that cannot foresee failures because of rising complexity and inadequate monitoring.
Undefined reliability targets
Teams that cannot balance speed and reliability because they have no SLO/SLI definitions.
High toil burden
Teams whose capacity is consumed by repetitive manual operations work and that want automation.
DEPTH
Technical and compliance depth
This service's depth on sector-specific technical and compliance topics.
SLO and error budget
We define SLOs for availability, latency and error rate and set a measurable balance between release speed and reliability work with an error budget policy.
Observability and tracing
We build the metrics/logs/traces layer with Prometheus, Grafana, OpenTelemetry and Jaeger and reduce noise while raising meaningful signal with multi-tier alerting.
Chaos engineering and post-mortems
We run blast-radius-limited experiments with Azure Chaos Studio and Litmus and turn every incident into a system improvement through a blameless post-mortem culture.
What It Solves
Systems that lack formal reliability engineering practices accumulate operational risk invisibly until a major outage exposes gaps in observability, incident response, and capacity planning. Without Service Level Objectives and error budgets, engineering teams have no quantitative basis for balancing feature delivery against reliability investment. Our SRE and Reliability Engineering service installs the practices, tooling, and culture that allow your systems to meet defined availability targets while maintaining sustainable development velocity.
SLI/SLO/SLA definition workshops aligned to business-critical user journeys
Observability stack implementation using Prometheus, Grafana, OpenTelemetry, and structured logging
On-call program design including runbook authoring, incident severity classification, and escalation paths
Chaos engineering program using Chaos Monkey, LitmusChaos, or AWS Fault Injection Simulator
Key Benefits
Benefit
Make risk and response indicators visible through measured controls, rehearsed playbooks, and evidence review
Benefit
Shorten operational cycle time against agreed measurement targets and acceptance criteria
Benefit
Turn the outcome into a measurable target with baseline, owner, and review cadence
The engagement covers the full reliability lifecycle from measurement baseline through operational maturity. We assess your current observability coverage, incident management process, and deployment safety practices, then build the tooling and processes needed to reach your target reliability tier. Scope includes both the technical implementation and the organizational practices needed to sustain reliability improvements.
Observability gap analysis across metrics, logs, and traces for all critical system components
SLO definition and error budget policy design with product and engineering alignment
Runbook library authoring covering the top 20 most common incident scenarios
On-call rotation design, escalation policy configuration, and blameless postmortem process implementation
Key Benefits
Benefit
Establish a quantitative reliability baseline that makes future improvement measurable and defensible
Benefit
Make operational speed, resilience, and response outcomes measurable through contracted scope and acceptance criteria
Benefit
Build organizational muscle for blameless postmortems that drive systemic reliability improvement
Google SRE Workbook model with 28-day rolling windows and multi-burn-rate alerts
Alerting Standards
Symptom-based alerting with severity classification and escalation policy automation
Capacity Planning
Predictive scaling models using historical metrics with 90-day demand forecasting
Deliverables
The SRE engagement delivers a functioning observability platform, a library of SLO-backed dashboards and runbooks, and an on-call program that your team can operate and evolve independently. All deliverables are documented and transferred with hands-on training to ensure operational self-sufficiency.
Production observability stack with metrics, logs, and distributed tracing fully configured
SLO dashboard suite covering all defined service level objectives with error budget burn rate alerts
Runbook library in your documentation platform covering incident detection, diagnosis, and resolution
Blameless postmortem template and facilitation guide for ongoing incident learning
Key Benefits
Benefit
SLO dashboards provide real-time reliability visibility to both engineering and executive stakeholders
Benefit
Runbook library reduces cognitive load during incidents and enables junior engineers to resolve common issues independently
Benefit
Postmortem process drives measurable reduction in repeat incidents over a 90-day period
Dashboard Formats
Grafana JSON models, Datadog dashboard-as-code, or Terraform-managed dashboard definitions
Runbook Platform
Confluence, Notion, PagerDuty Runbook Automation, or Git-based markdown
Alert Configuration
Prometheus AlertManager rules, Grafana OnCall policies, or PagerDuty service configuration
Training
On-call readiness workshop, SLO review cadence facilitation, and chaos game day facilitation
Frequently Asked Questions
Where do we start if we have no existing SLOs or observability?
We begin with a two-day SLO definition workshop with your engineering and product leadership to identify the top three to five user journeys that define system reliability from a business perspective. From these journeys, we define SLIs and set initial SLO targets, then implement the instrumentation needed to measure them within the first sprint.
How do error budgets help balance reliability and feature development?
An error budget is the allowed amount of downtime or errors within your SLO window. When the budget is healthy, teams can deploy aggressively. When it is nearly exhausted, deployment velocity is reduced and reliability work is prioritized. This creates a data-driven, conflict-free mechanism for product and engineering to negotiate the reliability versus velocity tradeoff.
Do you embed SREs into our team or work separately?
We offer both models. An embedded engagement places SRE specialists within your delivery teams to transfer knowledge and build internal capability over a defined period, typically three to six months. An advisory model provides SRE expertise and tooling implementation without embedding, suitable for teams that already have strong operational practices.
How do you handle legacy monolithic applications that are difficult to instrument?
We use OpenTelemetry auto-instrumentation agents and sidecar proxy patterns to add observability to legacy applications without requiring code changes. For systems where auto-instrumentation is insufficient, we identify the minimum set of critical instrumentation points and guide developers in adding targeted metrics and structured logging.
How often should SLOs be reviewed and updated?
We recommend a quarterly SLO review cadence that evaluates whether current targets remain aligned to business expectations, whether error budget policy is being followed, and whether observability coverage has gaps revealed by recent incidents. Initial SLOs are often intentionally conservative and tightened as reliability improves.
What is a chaos game day and how does it benefit our team?
A chaos game day is a scheduled exercise where controlled failure scenarios are injected into a staging or production environment to validate that monitoring detects the failure, alerts fire correctly, runbooks are accurate, and the on-call team can recover the system within SLO targets. Game days build team confidence and expose gaps before real incidents occur.
Related service groups
Compare the other workstreams under the same pillar as well.